Report Generator Script
Word (docx) reports
DragOnFlow can use standard Word documnets as temaplates for reports, add a word document into the project and mark it as reference.
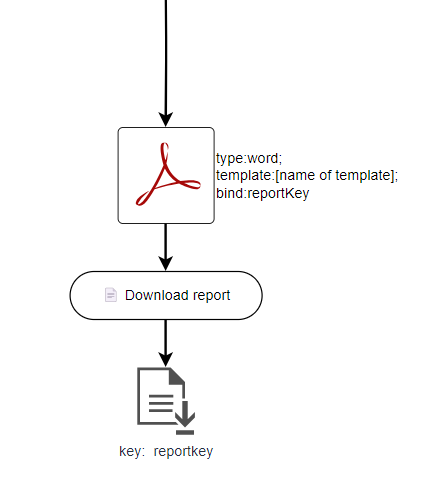
The following example generate report from a word document, note that the name of the resource [name of template] is the word document name without the extention (i.e. 'docx')
To place values of expressions (e.g. variables from the flowchart), use the '{#' expression '#}' placeholder, this will allow you to get calculate and format and variable of value.
When the report is generated, the placeholder is replaced with the actual value, this is exactly like the 'Text' shape from the flowchart. The report generator will use the same format as the placeholder (e.g. font, color...).
Special DocX commands
In word there are some extensions that you can use to control sections, tables...
Show hide section
Use this to hide complete sections from the document based on an expression
{# showsection: [expression] #}
{# hidesection: [expression] #}
when the report generator encounter this commands it will show/hide the entire section (that is word document section, that created using section breaks) from the result report.
To hide a part of the report, use this command is with a Continouos section breaks
Show hide paragraph
Use this to hide complete sections from the document based on an expression
{# showparagraph: [expression] #}
{# hideparagraph: [expression] #}
When the report generator encounter this commands it will show/hide the current paragraph (that is word document paragraph) from the result report.
Display Image
Show an image from an image key.
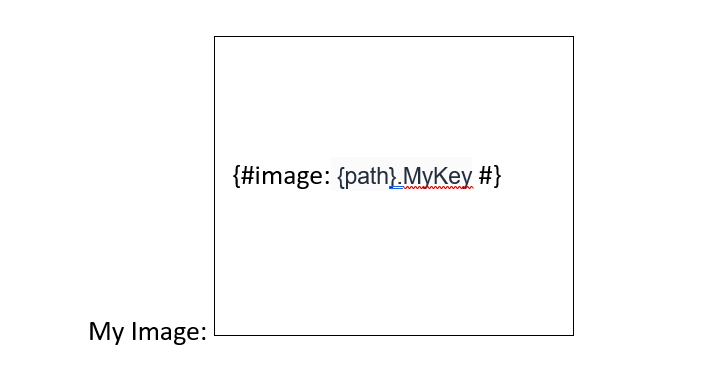
Use the {# image:... #} to insert an image, you can place images anywhere in the document, including headers/footers, tables...
| Attribute | Description |
|---|---|
| width | Force width on the image keeping aspect ratio |
| placeholder | If present shows a placeholder for the image when missing |
Option # 1
Insert a rectangle shape (use your prefered layout option), and set the size of the shape to the size you want the image (it will scale down/up accordingly).
Example:
Option # 2
Show the image inline, but control the width
{#! image,width=6cm: {visit_root}.imagekey #}
Embed audio
Embed an audio object in the report (support for PDF output is in progress). In word the audio will apear as an icon that when double clicked will play the audio (behaviour will depand on the device and version of MS Word).
{# audio: [key expression] #}
Dump variables
Use to debug your flowchart, this will place a list of all variable under the provided path.
{# dump: myresult.eval #}
This is not intended for the end user to see
Fill Table
You can fill a table with data from yout flowchart. Create the table place, column headers row, and a single data row, format everything as needed.
In the data row, in the first cell place {#FillTable:e: myData #} note the 'e' that will serve as the reference to the active row
We assume that the variable 'mydata' has content in form of hierarchical rows/column, example:
mydata.1.time = "12:20"
mydata.1.index = 10
mydata.2.time = "12:40"
mydata.2.index = 14
Now in the row cells place expressions like {# {e}.time #} this will get the 'time' of the current row, rows will be created by the report generator.
Example table in word: | Time | Index | |-|-| | {#FillTable:e: myData #}{# {e}.time #} | {# {e}.Index #} |
Result in the report:
| Time | Index |
|---|---|
| 12:20 | 10 |
| 12:40 | 14 |
Comment
Allow to place comments, comments are ignored and not rendered
Example:
{# // anything here is a comment #}
{# comment: anything here is a comment #}
IF Condition
if allows to conditionally do/show the content between the if and end if
Note! if can't be nested, and must apear in the same level of the document (e.g you can't have them in diferent sections, or have them in diferent table cells ... )
Example:
{# if: not isempty({w}.image) #}
Wound Size
Length  {# {w}. length #} cm
Width   {# {w}. width #} cm
Area    {# {w}.area #} cm²
Shape of wound  {# {w}.shape.text #}
{#image,width=3cm: {w}.image  #} {#image,width=3cm: {w}.composite  #}
{# end if: #}
don't forget the : after the end if
Foreach
Repeates a section based on a query
Example:
{# foreach: select e in {s_root}. concomitant_medication.items.%  order by e.lastpathsegment() as number asc #}
Date and time: {# {e}.timestamp. FormatShortDateTime() #}
{# Form, Name = “concomitant_medication”: e  #}
{# next: #}
HideByHeaderLevel
Removes/hides the entire part that is under the current header. This will search up until it finds a header (that apears in the TOC) then remove all the content and er it, including sub headers.
Example:
{# HideByHeaderLevel: [some expression] #}